The Bank of Canada kept its overnight rate steady at 1.75% this morning after speculation that it might raise the rate by 0.25% again. The rate has previously been increased by 0.25% five times since 2017 in an attempt to keep inflation in an acceptable range. The last rate increase was in October 2018.
The overnight rate is set by the Bank of Canada and it is the rate other banks use to lend one-day funds among themselves. This influences other rates such as consumer loans and mortgages. Keeping the rate unchanged means the current mortgages rates should hold steady for the time being.
Although the lending and mortgage rates should remain the same, other areas of the economy will be affected by the hold on rates. The bank downgraded its expectations for Canada’s economy in 2019 from 2.1% to 1.7% GDP growth. As far as real estate and mortgage rates go, fixed rates should stay the same and those who opted for a variable rate will enjoy a continued lower rate.
As we head into the fall months we tend to see more price reductions and homes coming off the market. That’s why it’s ever important to have your agent look into off-market properties, as they may still be willing to sell their home). We also tend to see last-minute buyers pulling the trigger on purchasing a home as they see inventory dropping.
We’ve broken down our Summer 2018 market analysis into three main areas: Corner Brook, Pasadena, and Deer Lake. Currently we are in a buyer’s market in all three areas.
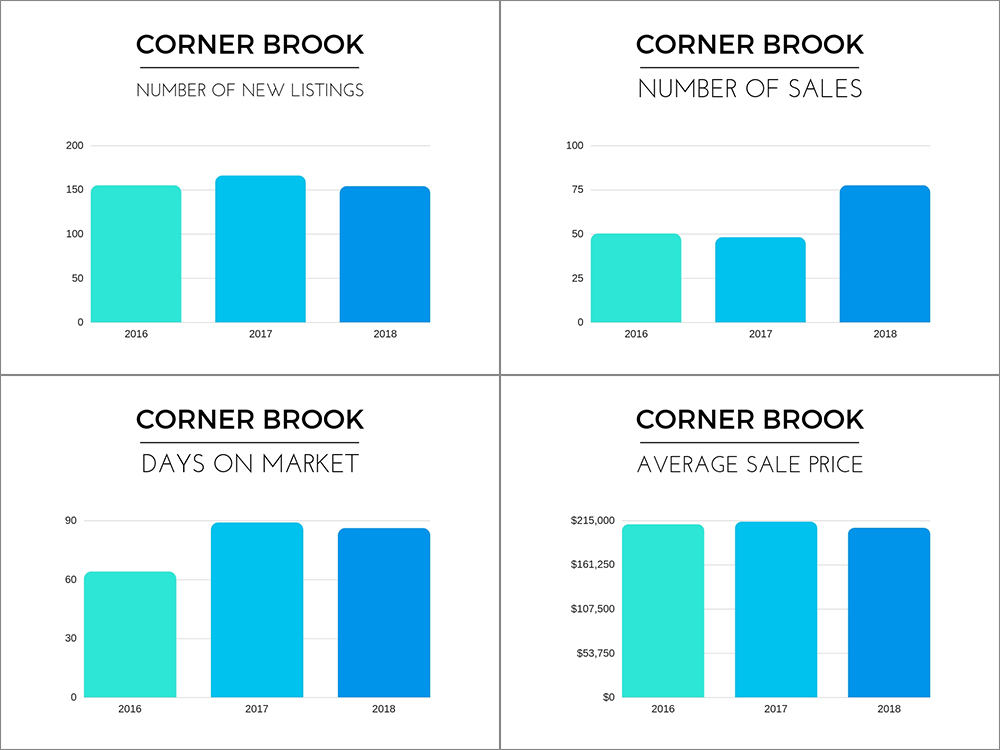
Corner Brook
Corner Brook Summer 2018 Market Update Charts
New Listings: -7.2%
Sales: -5.4%
Days to Sell: 21.3%
Average Sale Price: -3.4% * compared to Summer 2017
Listings are down 7.2% in Corner Brook over summer of last year and sales are down 5.4% The average price of a residential home is currently at $206,119, down 3.4% over last year. We are noticing buyers having an upper hand in a lot of transactions currently. Days on market seem to stand out the most, with a 21.3% increase from last year. Homes in Corner Brook currently take about 70 days to sell.
January and February tend to be the slower months, which means we still have a couple more months of active buyers and sellers trying to put a deal together. Last year’s fall months saw a surplus of listings, with the number of active listings comparing to the summer months of 2016.
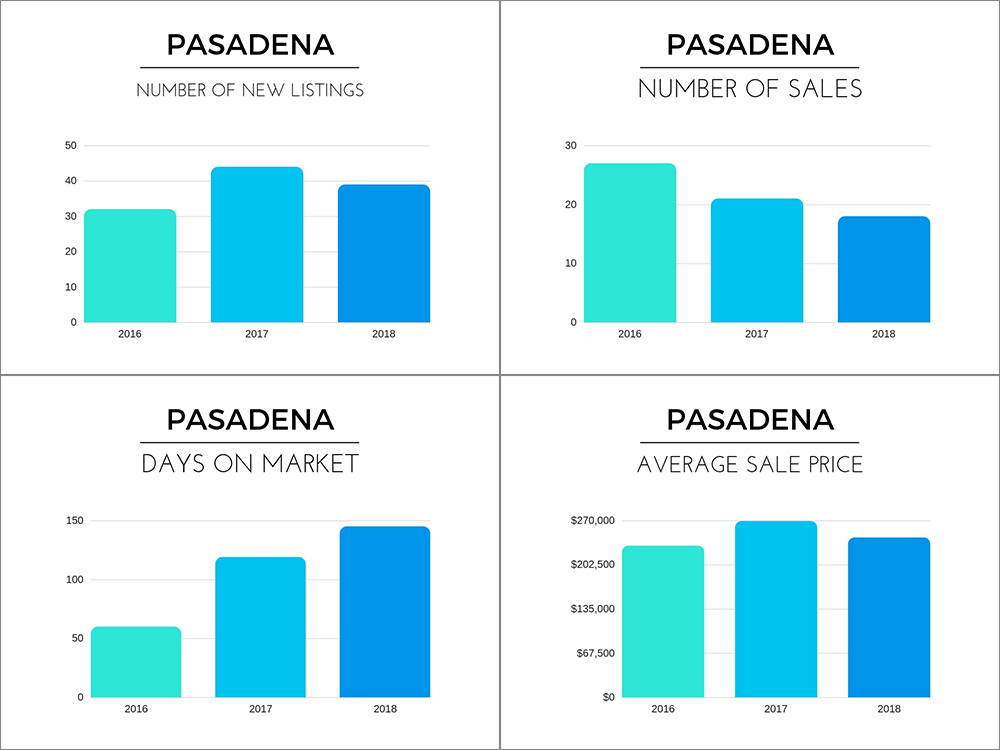
Pasadena
Pasadena Summer 2018 Market Update Charts
New Listings: -11.4%
Sales: -1.4%
Days to Sell: 21.8%
Average Sale Price: -9.3% * compared to Summer 2017
The number of new listings has decreased 11.4% over the same time last year but have increased over the last three years while the number of sales has decreased by 1.4%. Similar to Corner Brook, Pasadena is in a buyer’s market as well. Of most significance, the number of days to sell has risen substantially by 21.8%. It now takes more than twice as long to sell a home than just two years ago, which is currently 145 days.
The average sale price of homes in Pasadena, interestingly, have stayed roughly the same, even gone up a bit in the last three years, although it is down 9.3% over last year to $244,072. This can be contrinbuted to newer homes being sold in newer areas of town and buyers looking outside Corner Brook for homes with bigger yards in the $200,000 to $300,000 price range. Pasadena currently has the highest average home price between the three areas but also the highest number of days to sell.
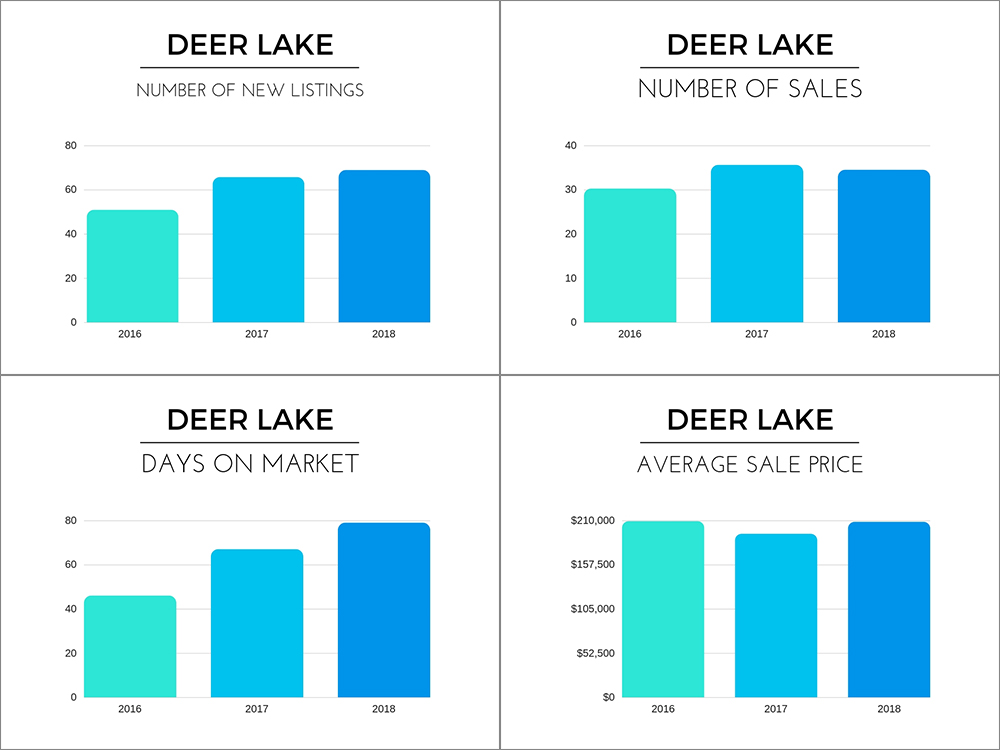
Deer Lake
Deer Lake Summer 2018 Market Update Charts
New Listings: -4.2%
Sales: -17.5%
Days to Sell: 17.9%
Average Sale Price: 7.3%
* compared to Summer 2017
The number of new listings has decreased 11.4% over the same time last year but have increased over the last three years while the number of sales has decreased by 1.4%. Similar to Corner Brook, Pasadena is in a buyer’s market as well. Of most significance, the number of days to sell has risen substantially by 21.8%. It now takes more than twice as long to sell a home than just two years ago, which is currently 145 days.
The number of new listings has remained high while sales have dropped by 17.5% while the number of days on market has increased 17.9% to 79 days. This indicates a strong buyer’s market as we head into the fall and winter months.
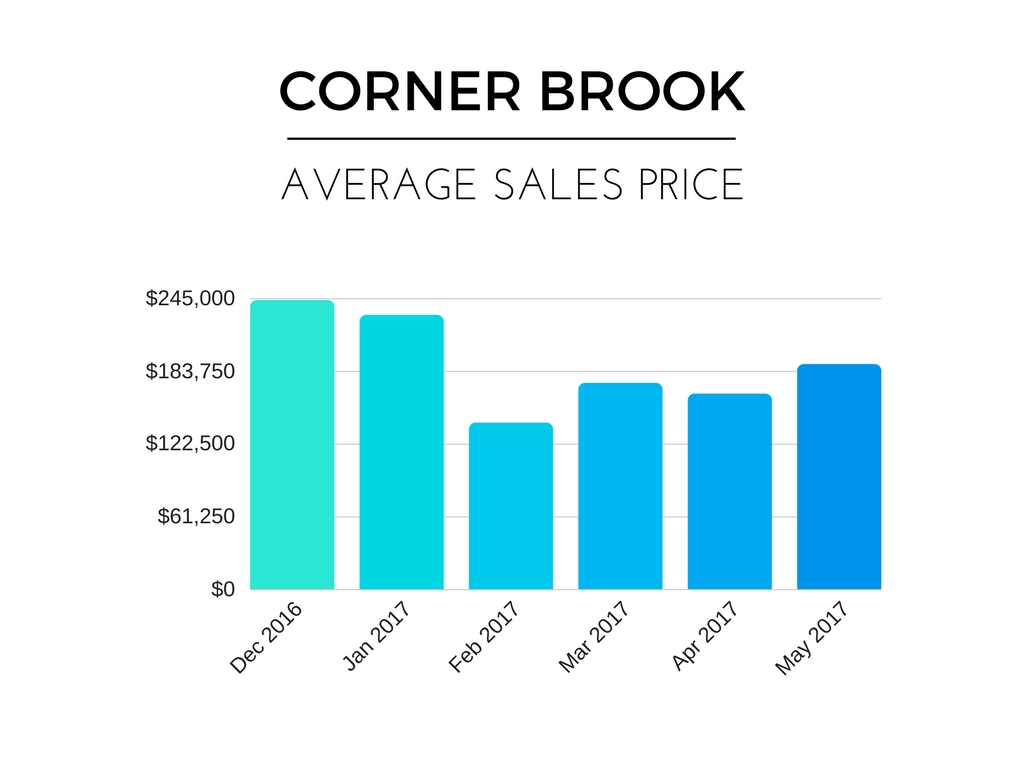
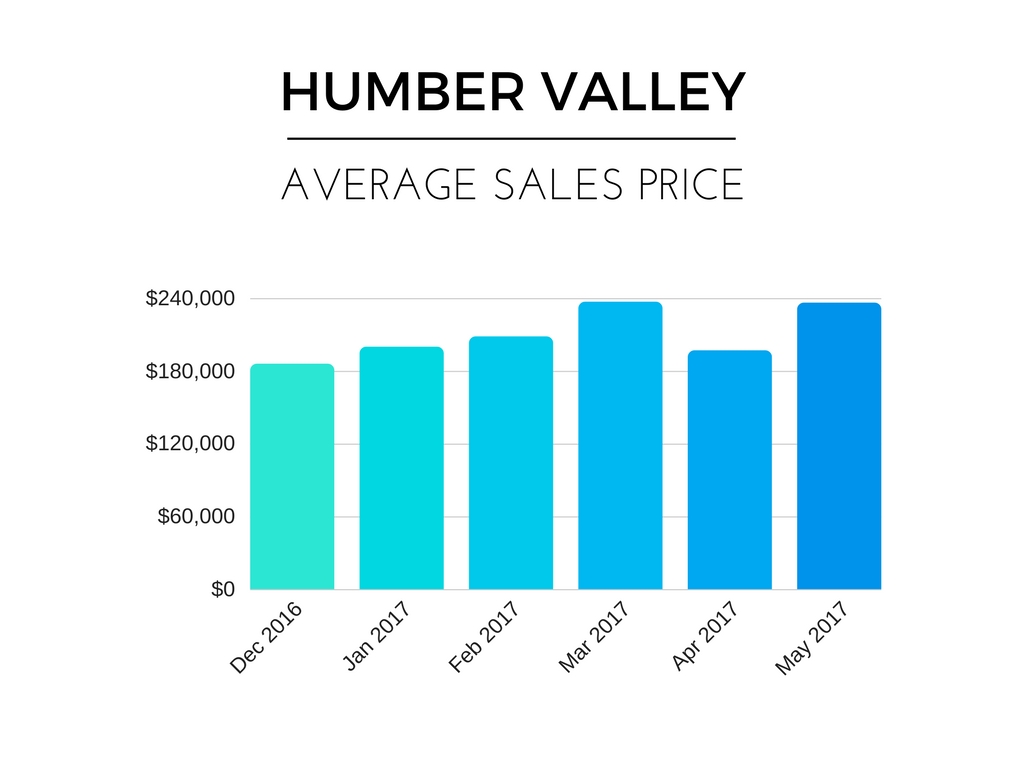
Here’s a quick market snapshot of what’s been happening in Corner Brook and the Humber Valley over the last six months
Corner Brook
The Corner Brook market has been relatively steady, hovering around the $180,000 mark. The drop in average price during the early months of 2017 is mostly due to more lower-priced homes selling as well as a higher number of listings on the market.
Pasadena
Pasadena also has a higher number of listings than previous yearly average.
Deer Lake
The strongest market has been Deer Lake, where the number of listings has been steady and the average price rose just slightly.