2019 Federal Budget Adds More Help For First-Time Home Buyers

2019 Federal Budget Canada

With rising housing costs across the country, the federal government has been pressured to do something to help younger first-time home buyers who have been priced out of the higher priced areas such as Toronto and Vancouver. The federal budget for 2019 has been released and there are two main additions regarding real estate and first-time home buyers.

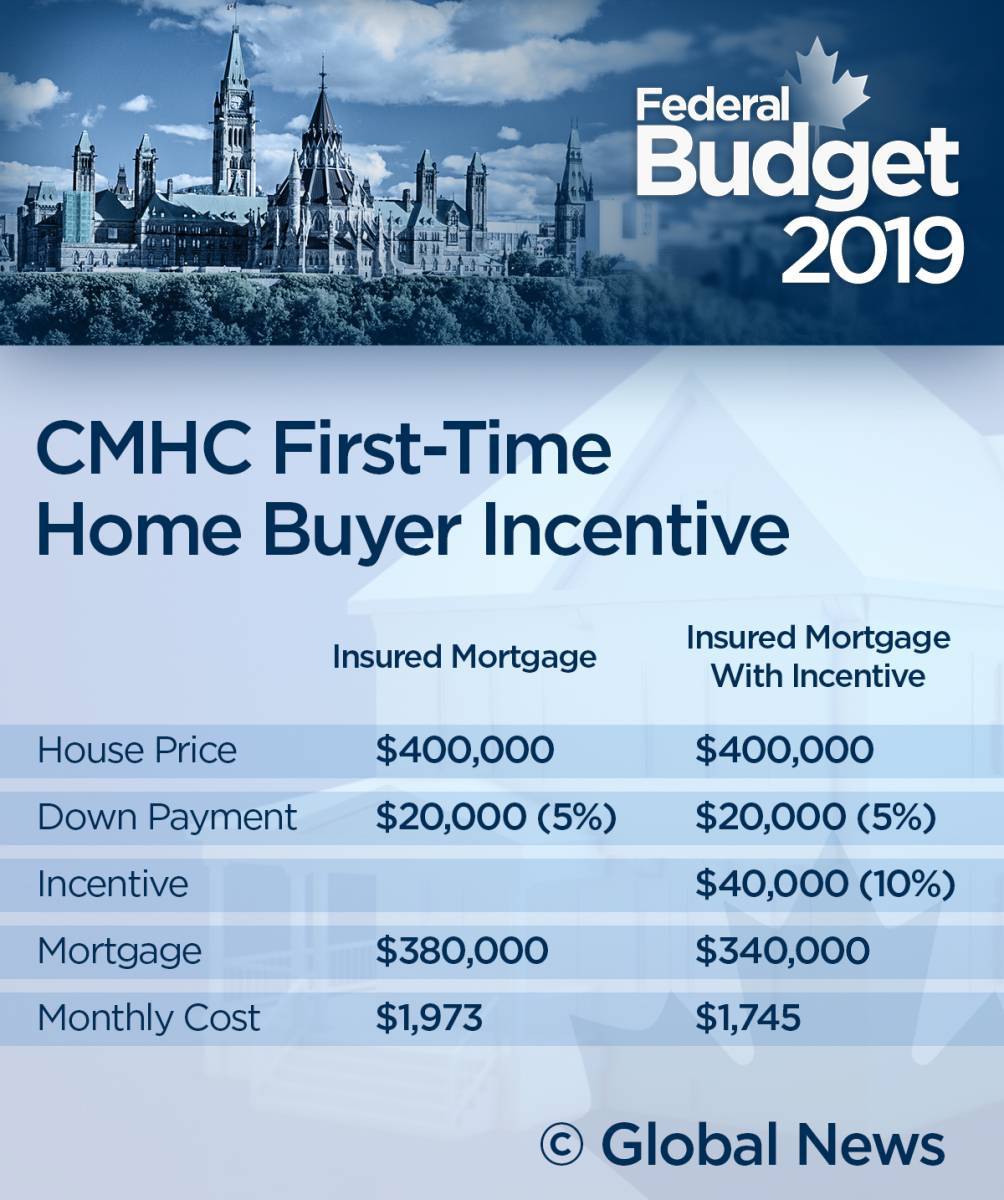
CMHC First-Time Home Buyer Incentive

The budget introduced the Canadian Mortgage and Housing Corporation (CMHC) First-Time Home Buyer Incentive. This allows prospective buyers who have the minimum down payment for a home to apply to finance between 5% and 10% of their mortgage via a shared equity program. Buyers can get up to 10% on newly constructed homes while 5% applies to existing homes. This would lower the mortgage amount borrowed and would help first-time home buyers qualify for a higher mortgage, even with the mortgage stress test, while also lowering their monthly mortgage payments.

This incentive would only apply to insured mortgages and the buyer would still have to come up with the minimum 5% down payment. Applicants must have a maximum household income of no more than $120,000 and the purchase price of the home can only be 4 times their household income. So, for a family of first-time home buyers with an annual household income of $80,000 the total mortgage size would be $320,000.

The budget document states “For example, if a borrower purchases a new $400,000 home with a 5% down payment and a 10% CMHC shared equity mortgage ($40,000), the borrower’s total mortgage size would be reduced from $380,000 to $340,000, reducing the borrower’s monthly mortgage costs by as much as $228 per month.”

Buyers will still have to repay the loan, although it is unclear at this point what the terms would be. Applicants still must qualify under the federal stress test, which ensures that borrowers will be able to keep up with their payments if their interest rates were to increase. However, the lower mortgage means the borrower would only need to qualify for the lower mortgage amount.

The finance department is hoping the new program will pass in time for a September, 2019 launch.

First-Time Home Buyer Incentive

Home Buyers’ Plan (HBP) Gets An Increase

The amount a borrower can withdraw from their RRSP for a down payment using the Home Buyers’ Plan (HBP) has been increased for the first time in 10 years. With increasing home values the federal government has increased the amount you can withdraw from your RRSP account from $25,000 to $35,000, or $70,000 per couple. The new limit will apply to withdrawals made after March 19, 2019, making it effective immediately.

2019 Corner Brook Real Estate Market Outlook

2019 Corner Brook Real Estate Market

What Happened In 2018

The Corner Brook real estate market has been slowing down over the last few years and we are now in a buyer’s market. Last year we saw the number of new listings decrease by 6.7% compared to 2017 while sales stayed the same (189 sales in 2017 and 190 sales in 2018). It’s a great time to find a good deal on a new home. If you’re a seller looking to get your home sold then it’s important to make sure your REALTOR© offers extensive marketing on your property.

Days On Market (the number of days it takes a home to sell when priced at market value) dropped to 79 days, however the average home price also dropped to $199,404, for all housing types. Interestingly, the median sales price dropped by a larger margin, telling us that more homes are selling in the lower price range of about $185,000 as opposed to the same home selling for less, although the average sale price did drop by 3.6%

2017 2018 Percent Change
Average Sale Price $206,795 $199,404 -3.6%
Median Sale Price $199,900 $184,500 -7.7%
Days on Market 94 79 -16%
Total New Listings 401 374 -6.7%
Total Sales 189 190 0.1%
Sale to List Price Ratio 94.3% 93.9%


2017 2018 Percent Change
Single Family $204,856 $197,985 -3.6%
2-Apartment $234,960 $237,222 1%
Mobile Homes $59,500 $59,417

What To Expect In 2019

Last year the province had the lowest GDP growth of 0.4%. This year we are expected to lead all other provinces with a GDP growth of 5.2%. This is mostly fueled by increased offshore oil royalties and oil projects such as the By Du Nord project coming online. With new money being pumped into the economy we are hoping to see a rebound in the real estate market in 2019. We are already seeing increased activity in the first two months of this year.

If you have any questions about the real estate market you can call/text Mike Bishop at (709) 638 – 4655 or email mikebishop@hotmail.com

Summer 2018 Market Update

As we head into the fall months we tend to see more price reductions and homes coming off the market. That’s why it’s ever important to have your agent look into off-market properties, as they may still be willing to sell their home). We also tend to see last-minute buyers pulling the trigger on purchasing a home as they see inventory dropping.

We’ve broken down our Summer 2018 market analysis into three main areas: Corner Brook, Pasadena, and Deer Lake. Currently we are in a buyer’s market in all three areas.

Corner Brook

Corner Brook Summer 2018 Market Update
Corner Brook Summer 2018 Market Update Charts

New Listings: -7.2%
Sales: -5.4%
Days to Sell: 21.3%
Average Sale Price: -3.4%
* compared to Summer 2017

Listings are down 7.2% in Corner Brook over summer of last year and sales are down 5.4% The average price of a residential home is currently at $206,119, down 3.4% over last year. We are noticing buyers having an upper hand in a lot of transactions currently. Days on market seem to stand out the most, with a 21.3% increase from last year. Homes in Corner Brook currently take about 70 days to sell.

January and February tend to be the slower months, which means we still have a couple more months of active buyers and sellers trying to put a deal together. Last year’s fall months saw a surplus of listings, with the number of active listings comparing to the summer months of 2016.

Pasadena

Pasadena Summer 2018 Market Update
Pasadena Summer 2018 Market Update Charts

New Listings: -11.4%
Sales: -1.4%
Days to Sell: 21.8%
Average Sale Price: -9.3%
* compared to Summer 2017

The number of new listings has decreased 11.4% over the same time last year but have increased over the last three years while the number of sales has decreased by 1.4%. Similar to Corner Brook, Pasadena is in a buyer’s market as well. Of most significance, the number of days to sell has risen substantially by 21.8%. It now takes more than twice as long to sell a home than just two years ago, which is currently 145 days.

The average sale price of homes in Pasadena, interestingly, have stayed roughly the same, even gone up a bit in the last three years, although it is down 9.3% over last year to $244,072. This can be contrinbuted to newer homes being sold in newer areas of town and buyers looking outside Corner Brook for homes with bigger yards in the $200,000 to $300,000 price range. Pasadena currently has the highest average home price between the three areas but also the highest number of days to sell.

Deer Lake

Deer Lake Summer 2018 Market Update
Deer Lake Summer 2018 Market Update Charts

New Listings: -4.2%
Sales: -17.5%
Days to Sell: 17.9%
Average Sale Price: 7.3%
* compared to Summer 2017

The number of new listings has decreased 11.4% over the same time last year but have increased over the last three years while the number of sales has decreased by 1.4%. Similar to Corner Brook, Pasadena is in a buyer’s market as well. Of most significance, the number of days to sell has risen substantially by 21.8%. It now takes more than twice as long to sell a home than just two years ago, which is currently 145 days.

The number of new listings has remained high while sales have dropped by 17.5% while the number of days on market has increased 17.9% to 79 days. This indicates a strong buyer’s market as we head into the fall and winter months.

June 2017 Market Update

Real Estate Market Update

Here’s a quick market snapshot of what’s been happening in Corner Brook and the Humber Valley over the last six months

Corner Brook Average Sales Price

Humber Valley Average Sales Price

Corner Brook
The Corner Brook market has been relatively steady, hovering around the $180,000 mark. The drop in average price during the early months of 2017 is mostly due to more lower-priced homes selling as well as a higher number of listings on the market.

Pasadena
Pasadena also has a higher number of listings than previous yearly average.

Deer Lake
The strongest market has been Deer Lake, where the number of listings has been steady and the average price rose just slightly.